 Deutsch
 English
Examples
Some cases for Advanced Data Analysis
Typically, archers buy 12 or more arrows as a set, and then want to select a subset of e.g. 6 arrows that provide the best grouping value. RyngDyng supports this arrow selection in various ways.
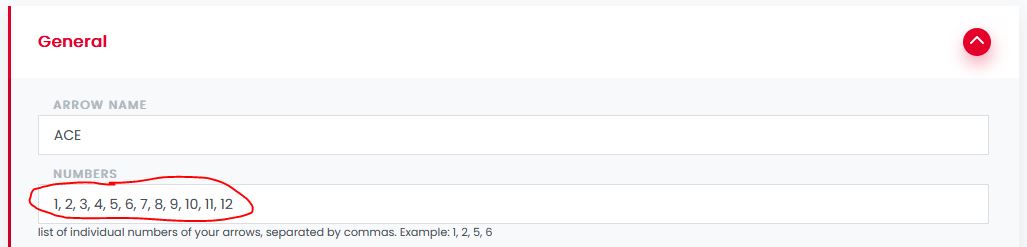
First, in the section on the material used inside your server account ( my arrows ) you can provide the numbers that you wrote on your arrow shafts:
These numbers will be automatically offered for selection inside the RyngDyngApp when shooting. For this, it is very convenient to activate the autoID function at the bottom of page hits:
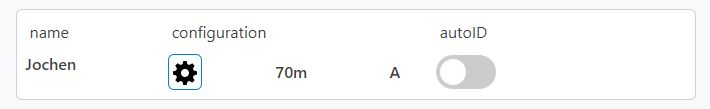
When autoID is active, after each shot there will be a pop-up on the screen allowing you to tap on the number of the arrow just shot. Used arrow IDs will be gray, unused numbers still red.
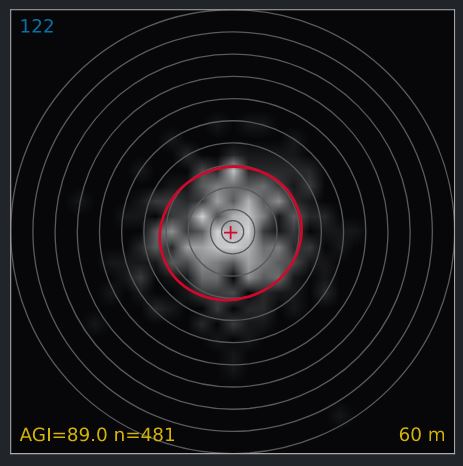
Here is a real example of a best arrow selection carried out by an archer using this method. The first image shows all recorded arrows using the Scatter ellipses per target type and distance analysis. The filter has been set to the day of recording, used target (122cm) and the used distance (60m). There are 481 recorded arrow positions and having an AGI = 89.0.
As a next step, he ran the best set of six arrows analysis on those arrows. This was the result:
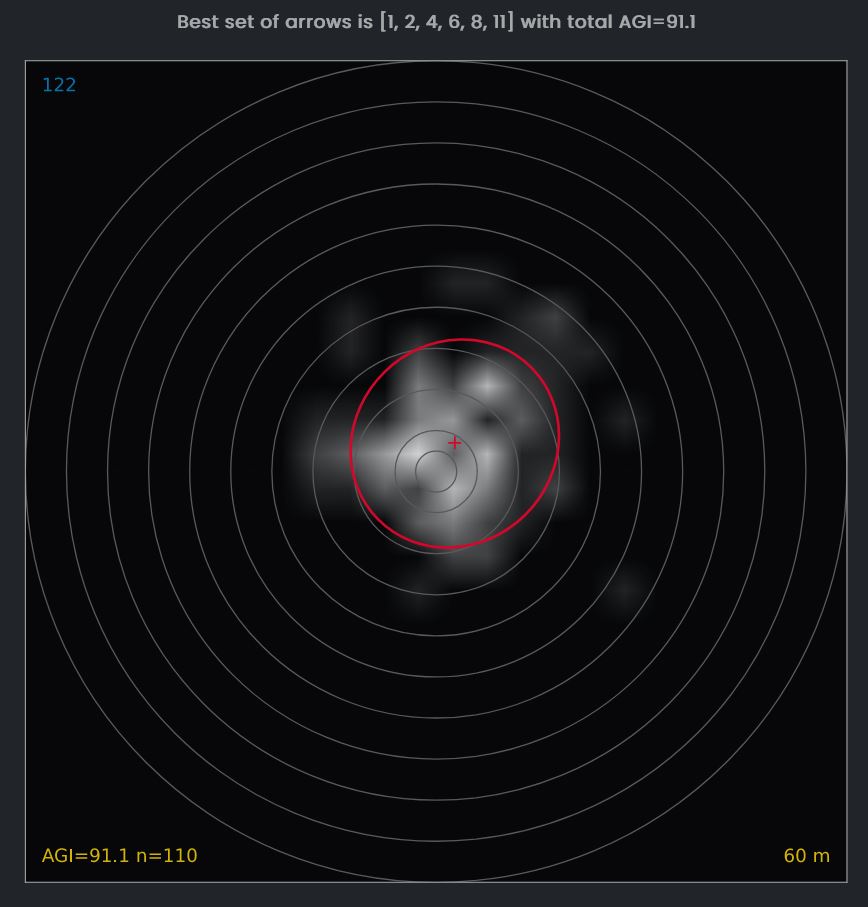
The best set of arrows is numbers 1, 2, 4, 6, 8, 11. The AGI that would have been achieved when using only those 6 arrows is 91.1. This corresponds to a much more narrow grouping compared to all 12 arrows (89.0).
Also note that the selected 6 arrows have a different group center than all arrows together. If you use those 6 arrows only, you will need to adjust the sight differently.
Is your first shot always better than the second or third? Or does another pattern prevail? If you know the answer to these questions you can directly focus on the shot that is less optimal.
After having recorded a larger number of arrows, in the server account choose the comparative analysis AGI and dispersions versus arrow sequence. Optionally you can filter by day, target type, etc. The following image shows the result of >600 recorded arrows of a very good recurve archer:
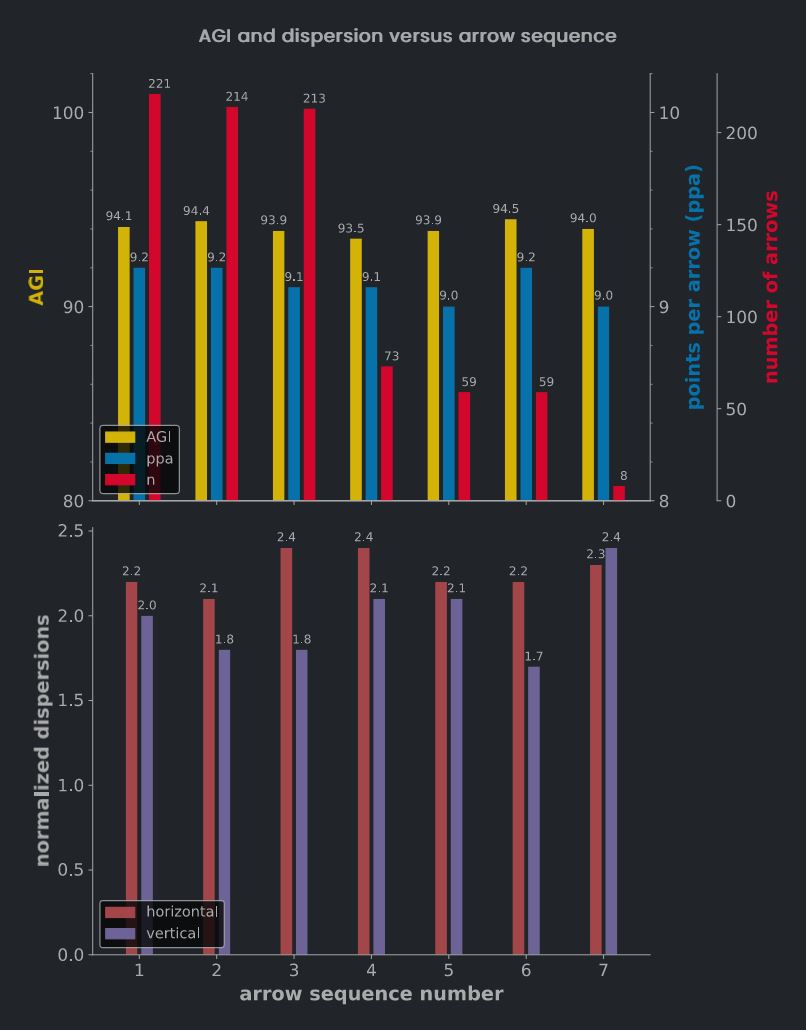
Let's focus on the first 3 shots of each end (arrow sequence numbers 1, 2 and 3). You will find that the third shot has a lower points per arrow figure (ppa, blue bars): 9.1 versus 9.2 for the first two shots. Also the AGI figure (yellow bars) for all 3rd shots is lower, that is they are more scattered than the first and second shots.
The lower graph sheds more light on this problem: It is the horizontal dispersion that is increased for the third shots compared to the first and second.
Now, with this knowledge the archer will be able to specifically concentrate on the factors that have an influence on the horizontal dispersion when shooting the third arrow: string shadow, canting, spotaneous release. If he manages to raise the ppa figure from 9.1 to 9.2 for the third shots (the ppa value that he could do on the first two shots of an end), then he will increase his overall result by 1 point per 10 ends shot.
A compound archer recorded 750 arrows and ran the outliers per target and distance analysis. In this case, there is no comparison between different target types and distances, just a single compound spot target at 50m. The following image shows the result:
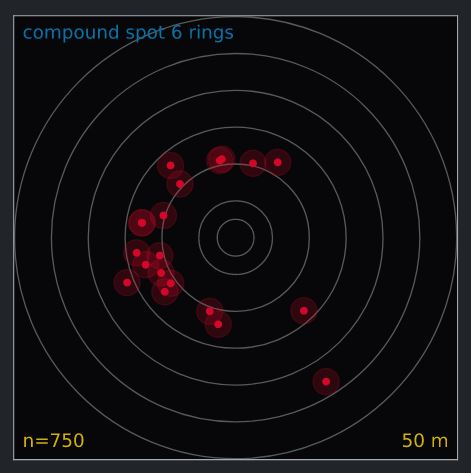
The archer verified that the group center of all 750 arrows was not shifted to the left, it was centered. Therefore, there must be another reason why the outliers tend to the left side of the target. Approximately 2% of all shots hit the 8 ring on the left.
With this information, the archer can specifically work on that problem and try out various changes at the bow or arrows or the shooting style. For example, the archer could record the arrow IDs for each shot and investigate whether it is a problem of some arrows. Or, she could try another bow grip and compare the result. Her coach will certainly come up with further ideas, once this information has been revealed.